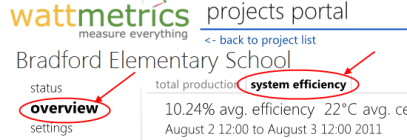
We're happy to announce the release of a new analytical tool: system efficiency metrics. Now available via the projects portal on every project with a WattMetrics weather station.
Data Points
This new chart combines the total panel area, data from a WattMetrics weather station with data aggregated from all the inverters at a project to calculate the following data points:
- Available Energy (kWh/m2) As reported by the irradiance sensor on the WattMetrics weather station.
- Realized Energy AC (kWh/m2) As reported by the inverter(s) (or revenue-grade meter if installed).
- Average Cell Temperature As reported by the cell temp. sensor on the WattMetrics weather station.
- Average DC Voltage As reported by the inverter(s).
- Total System Efficiency This is calculated by comparing the amount of energy available (irradiance * panel area) with the actual AC output as reported by the inverters (or production meter if available).
Interesting Insights
Once these data histories are presented together, some basic priciples of photovoltaic systems are made readily apparent.
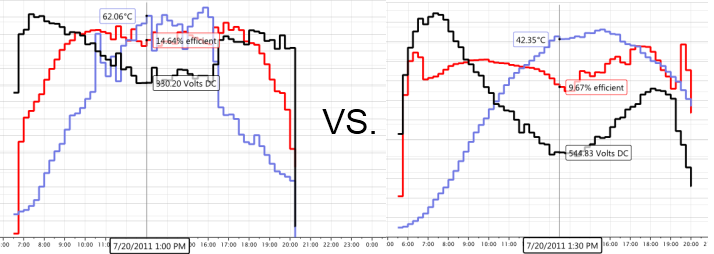
Cell temperature has a dramatic affect on output voltage:

Not all inverters/systems are equal:
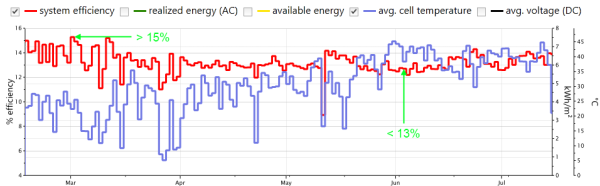
Average cell temperature has a long term impact on system efficiency:
The Bad News
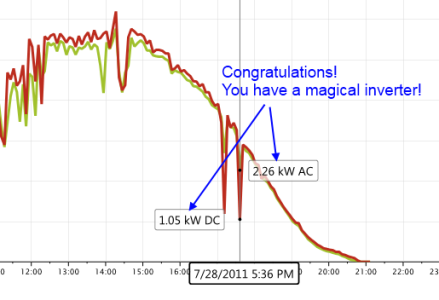
All the inverters we support provide values for DC generation, which allows us to calculate realized energy DC and total panel efficiency. Unfortunately, all the inverters we looked at provide DC data that is very poorly correlated with the AC data. This results in some average efficiencies of >100%. Since we're pretty sure the inverters aren't magical, we had to abandon those data points.
What's Next
Coming soon will be new automatic alerts based on total system efficiency.